Basic Dashboard Overview
The VpAdmin Basic Dashboard provides a quick overview of your website's key metrics and performance indicators, allowing you to monitor its growth and activity at a glance.
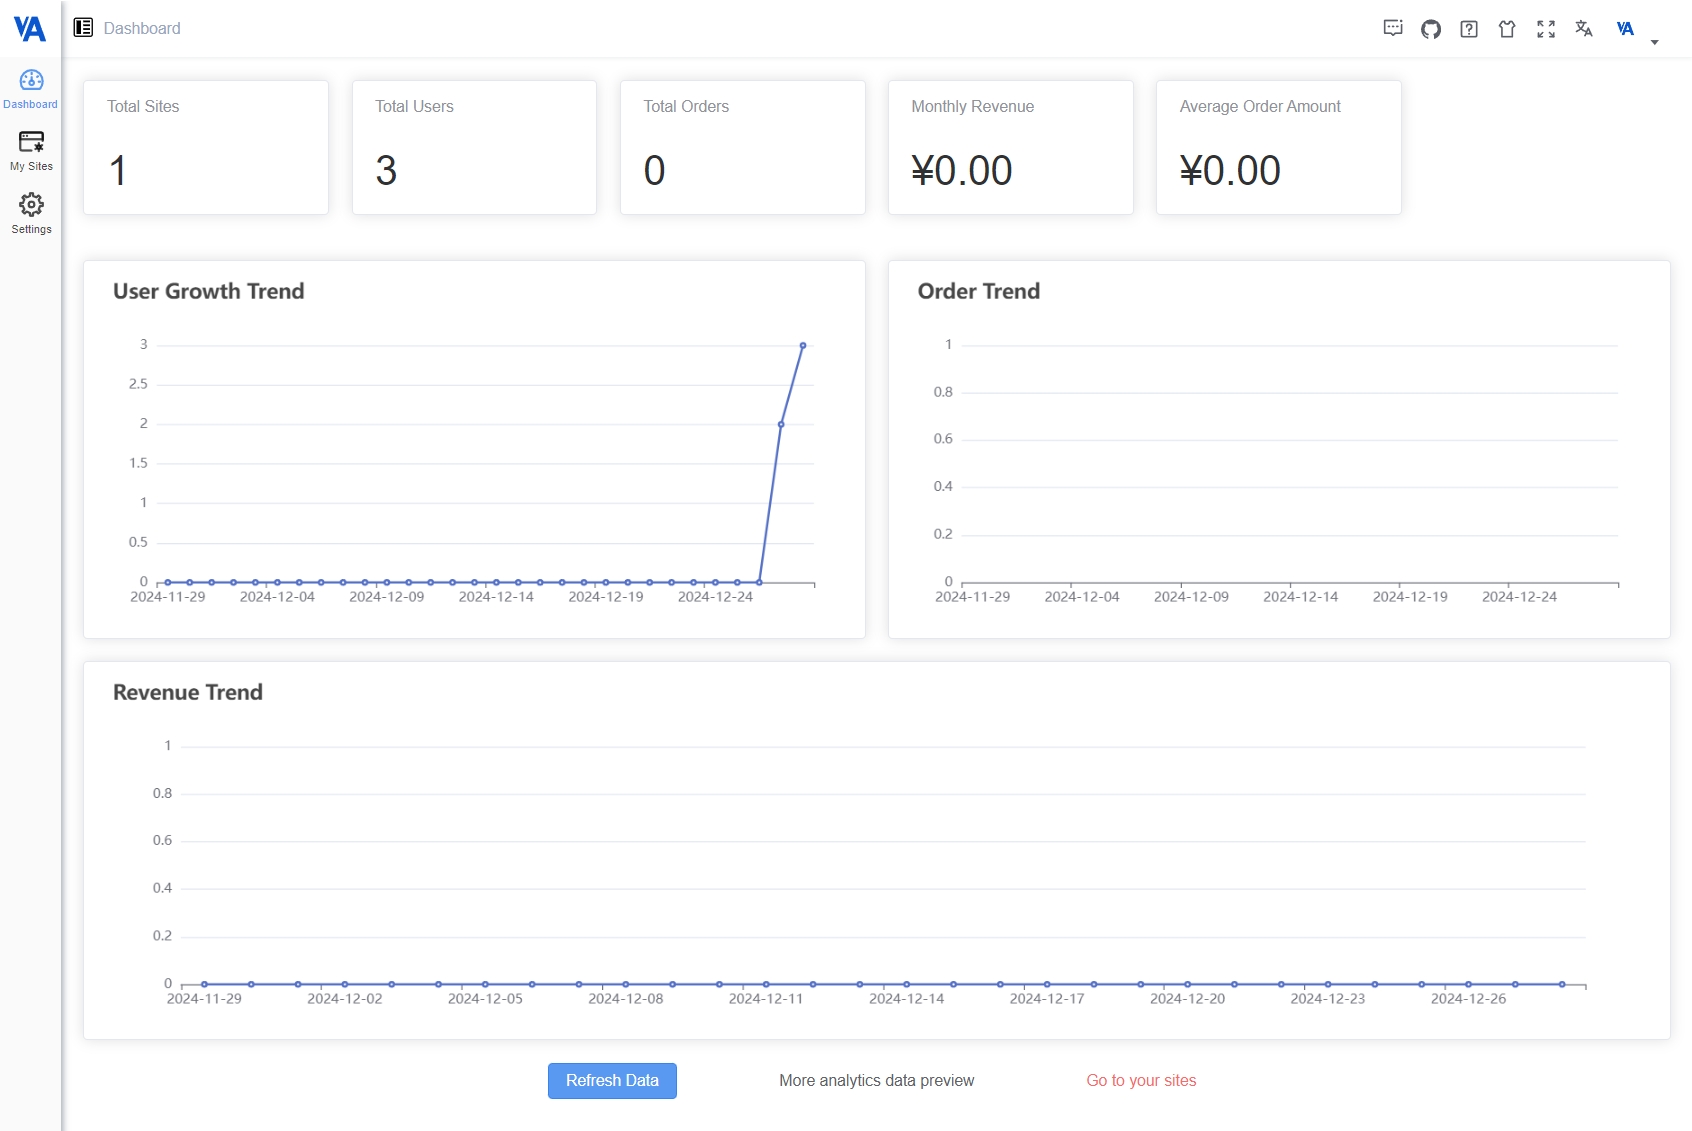
Key Metrics:
- Total Sites: Displays the total number of websites currently managed through your VpAdmin account.
- Total Users: Shows the total number of registered users across all your sites.
- Total Orders: Indicates the total number of orders placed across all your sites, if you have integrated payment functionality.
- Monthly Revenue: Displays the total revenue generated through your websites for the current month.
- Average Order Amount: Shows the average amount per order, providing insights into customer spending behavior.
Trend Charts:
The dashboard includes interactive trend charts that visualize your website's performance over time.
- User Growth Trend: Track the increase in registered users over a period.
- Order Trend: Monitor the number of orders placed over time, helping you identify trends and patterns.
- Revenue Trend: See how your monthly revenue changes over time.
Interactive Features:
- Refresh Data: Use the "Refresh Data" button to update all displayed metrics with the latest information.
- More Analytics Preview: Click the "More analytics data preview" button to explore advanced analytics options.
- Go to your sites: Click the "Go to your sites" button to jump directly to your website management section.
Dashboard Screenshot:
The Basic Dashboard is designed to provide essential performance insights in a user-friendly format, enabling you to monitor key indicators and make informed decisions about your online presence.